Built for serious environments

Breathe Data. Act with Confidence.

Qtroo combines precision IoT sensing, secure cloud analytics, and actionable alerts to help organisations protect people, assets, and compliance in environments where air quality matters.

📡
Real-time visibility
Continuous environmental data from connected sensors.
📊
Historical analysis
Trend review for auditing, optimisation, and incident follow-up.
🚨
Intelligent alerts
Email and phone notifications when thresholds are breached.
Operational assurance
Structured evidence for OHS, quality, and environmental controls.
Collage of Qtroo product dashboards showing overview, TVOC gauges, and historical trend views
🌡️
Temperature
Thermal stability
💧
Humidity
Comfort and storage integrity
🧪
TVOC
Chemical exposure risk
🫁
eCO₂
Ventilation quality
📈
AQI
At-a-glance air status
Why air quality matters

The science behind better indoor environments

Indoor air quality significantly influences health, cognition, chemical stability, and workplace safety. Elevated carbon dioxide can reduce cognitive performance. Volatile organic compounds can indicate exposure to harmful fumes. Temperature and humidity affect pharmaceutical stability, comfort, and material integrity.

HealthReduce exposure to harmful compounds and poorly ventilated conditions.
SafetyDetect issues before they become incidents or compliance failures.
ComfortSupport productive, comfortable indoor spaces for occupants.
What Qtroo measures

A complete view of environmental quality

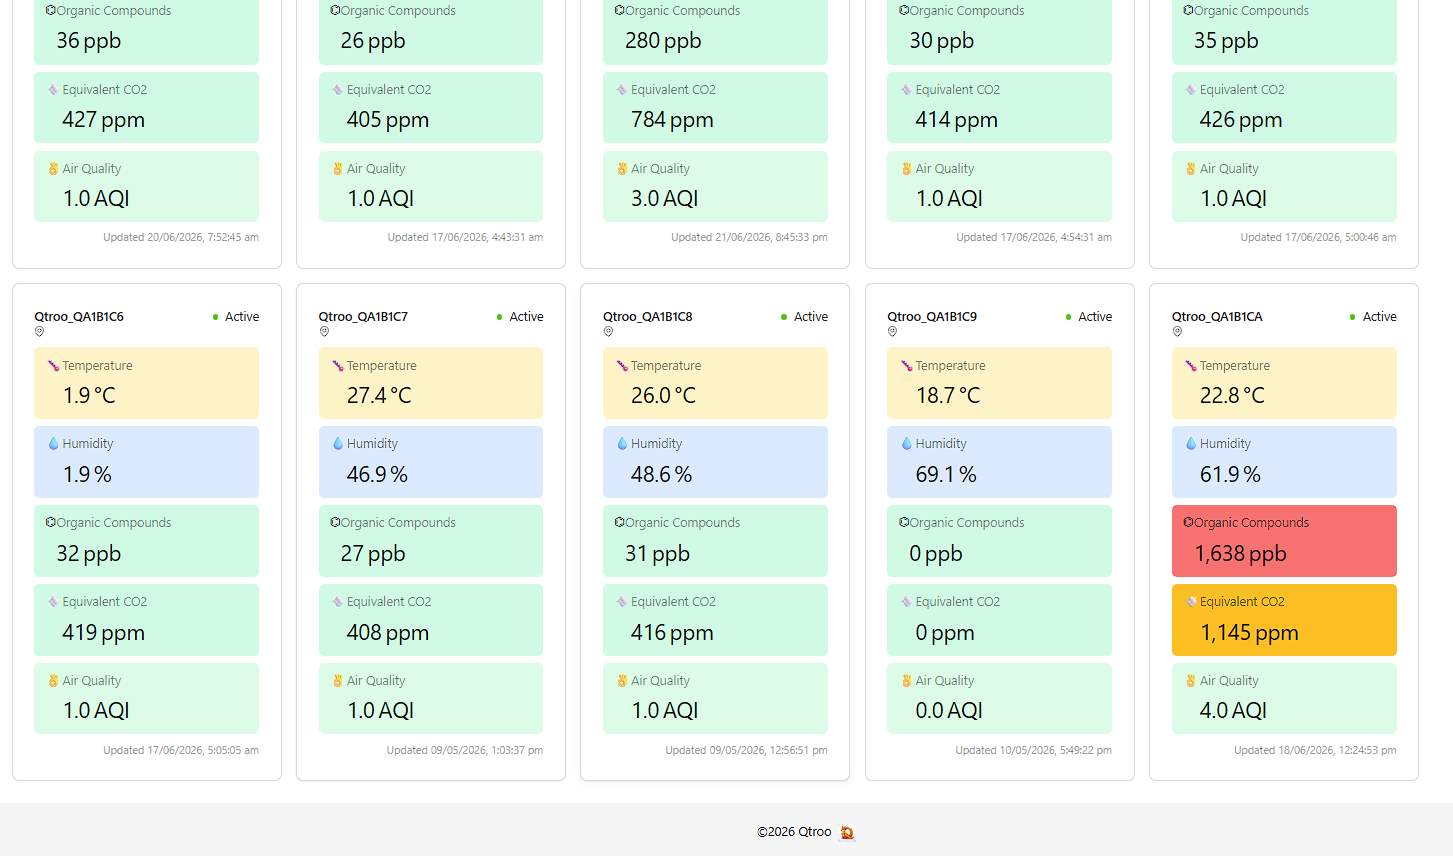
Qtroo sensors measure the parameters that matter most for environment control, operational assurance, and air safety.

🌡️

Temperature

Maintain thermal ranges that protect goods, equipment, and occupant comfort.

💧

Humidity

Manage moisture-related risks such as degradation, discomfort, and condensation.

🧪

TVOC

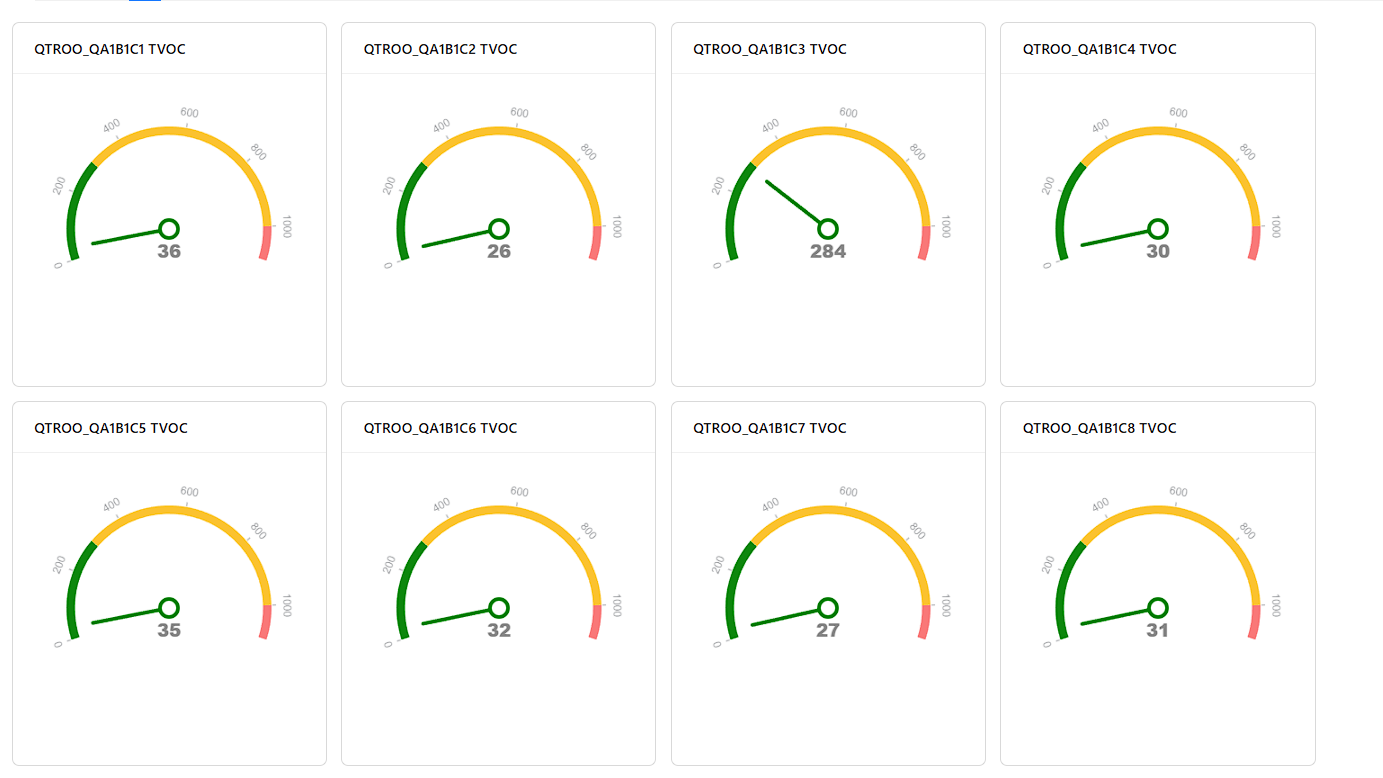
Track volatile organic compounds to identify fumes and airborne chemical risks.

🫁

eCO₂

Monitor ventilation quality that affects concentration, freshness, and respiratory comfort.

AQIProvides a simple, holistic air quality indicator.
Cloud connectedData is securely available online across locations.
Real-timeSee current conditions and changes as they happen.
Historical trendsUnderstand patterns over time to support decisions.
How the solution works

From sensor reading to informed action

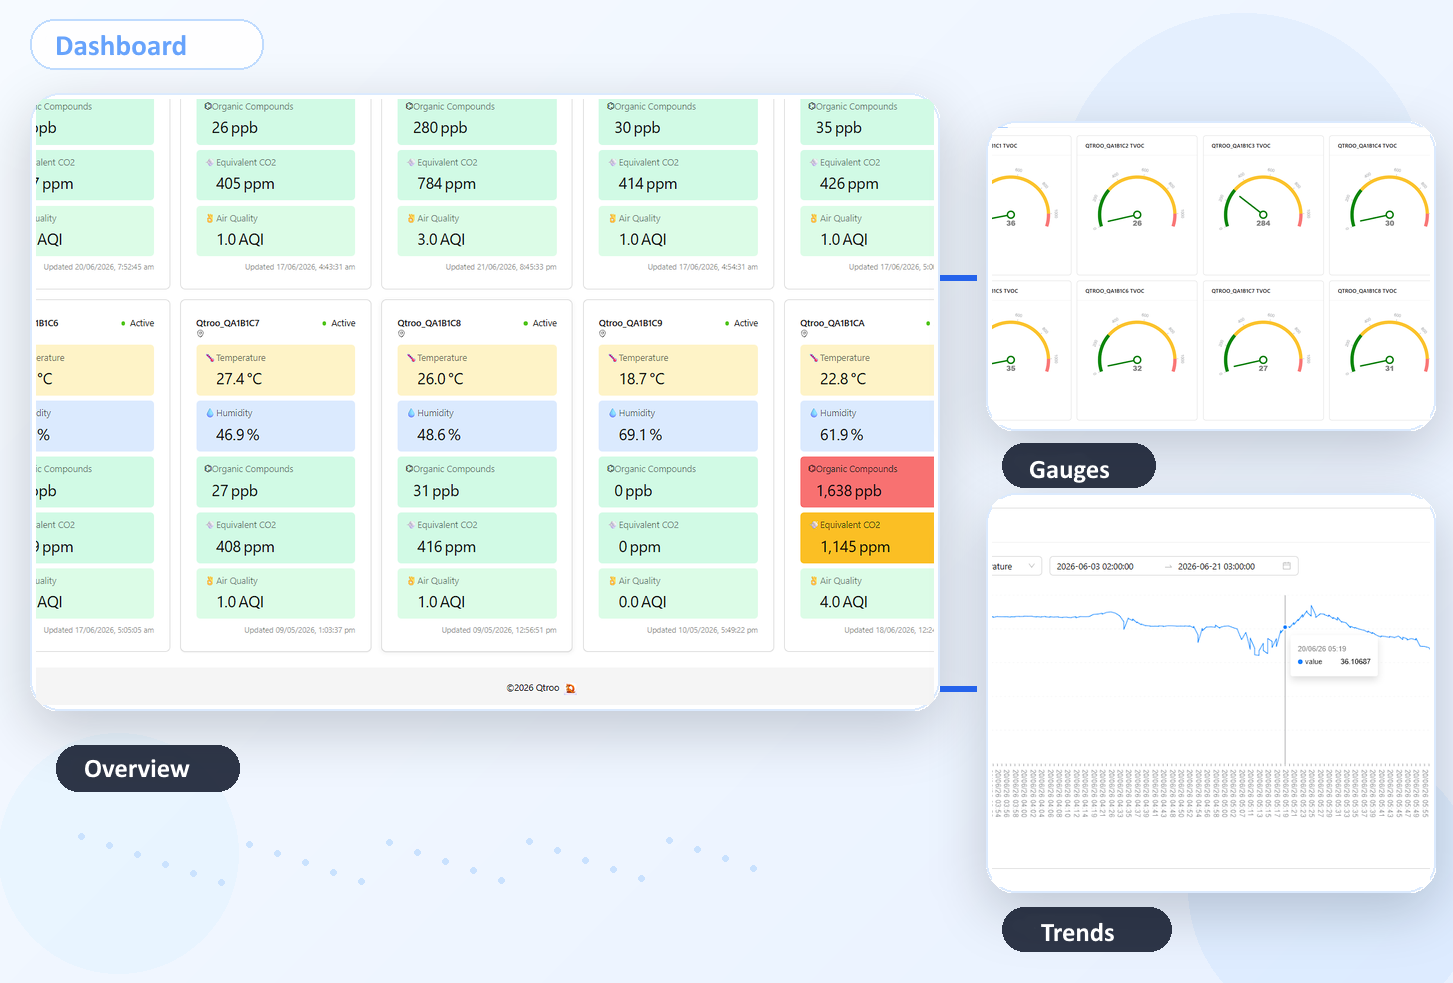
Qtroo turns invisible environmental conditions into visible, actionable insight for teams that need to respond quickly and document performance confidently.

Workflow diagram showing sensors, cloud, dashboard, and alerts
Product in action

Real dashboard views from the Qtroo platform

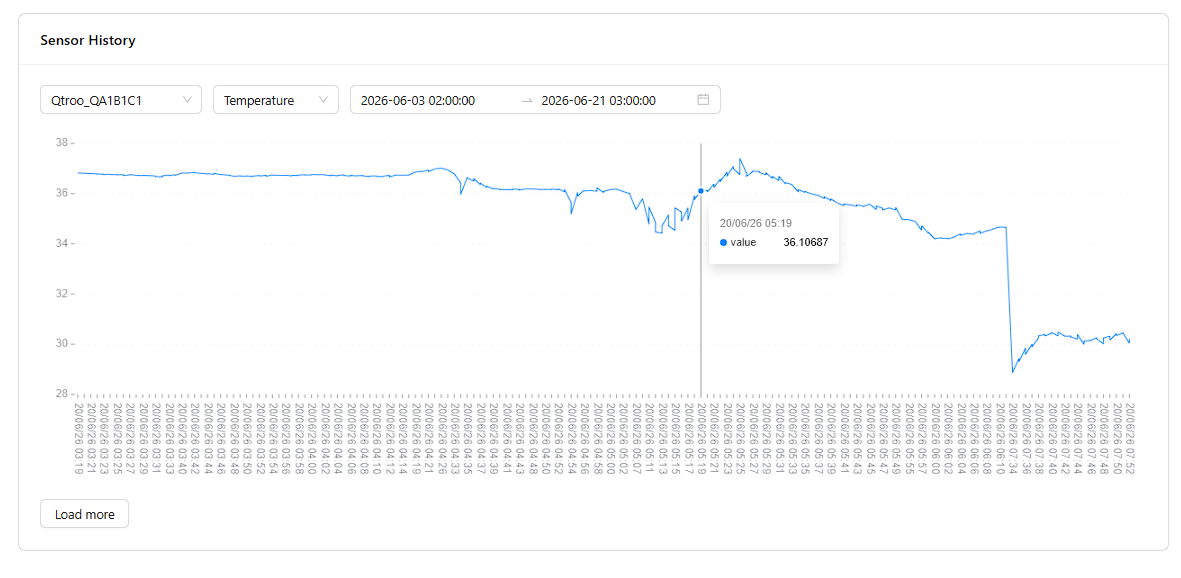
The Qtroo platform gives users real-time measurements, environmental snapshots, and historical trend analysis, helping teams understand current conditions and investigate changes over time.

Qtroo dashboard overview showing multiple active sensor panels with temperature, humidity, organic compounds, equivalent CO2, and air quality values
Overview dashboard: Multi-sensor visibility across key metrics, current values, and alert colours for quick interpretation.
Qtroo TVOC dashboard showing gauge cards for multiple sensors with volatile organic compound measurements
Gauge view: TVOC gauges provide an immediate indication of chemical exposure levels by sensor.
Qtroo history dashboard showing a line chart of temperature over time for a selected sensor
Trend analysis: Historical charts show how conditions evolve across time windows, supporting optimisation and investigations.
“You can’t manage what you don’t measure — and air is no exception.”
Qtroo helps teams move from invisible risk to proactive control using data that is clear, accessible, and operationally useful.
Qtroo advantage
  • Precision IoT monitoring with secure cloud connectivity
  • Real-time dashboard and historical trend analysis
  • Phone and email alarms when limits are breached
  • Evidence to support OHS, quality, and assurance commitments
Industries we serve

Relevant outcomes for different environments

Qtroo is built for organisations that need dependable environmental awareness, documented performance, and confidence that indoor conditions remain within safe or desired ranges.

Illustration representing a pharmacy

Pharmacies

Protect medicine efficacy by maintaining appropriate storage conditions and documenting the environment around sensitive stock.

  • Maintain stable temperature and humidity ranges
  • Detect harmful VOC conditions early
  • Build auditable records for assurance and compliance
Illustration representing aged care

Aged Care

Create healthier, safer living environments for residents who are more vulnerable to poor indoor air quality.

  • Monitor ventilation and carbon dioxide build-up
  • Maintain comfortable humidity and temperature
  • Provide reassurance for families and regulators
Illustration representing a school or laboratory

Schools and Laboratories

Help keep learning spaces healthy and laboratories free from dangerous fume accumulation.

  • Track classroom ventilation quality
  • Detect VOC-related risks in labs
  • Support student wellbeing, focus, and duty of care
Illustration representing an office building

Office Buildings

Provide transparent environmental performance data that supports OHS obligations and tenant confidence.

  • Demonstrate healthy workplace conditions
  • Support productivity and tenant satisfaction
  • Complement compliance and ESG narratives